
Energy keeps getting more expensive
Electricity prices for businesses are rising, and energy has become a line item that directly affects margins and export competitiveness.
Resource intelligence for industrial and commercial facilities
OMNI IQ meters electricity per phase and per machine, turns the readings into clear recommendations and reports, and takes your team to concrete savings. The platform comes with the engineers who install it and interpret it. Water and gas are next.
Compressor K2 runs between shifts
From 22:00 to 06:00 it draws 14 kW on average while production is idle.
Estimate: about 2,900 kWh per month
Why now
Without metering per machine and per shift you cannot see where energy goes, what runs when nobody works, and which investment actually pays back.
Energy monitoring is the continuous, automatic metering of energy consumption at the level of the facility, the switchboard and individual machines, with history and analysis. Instead of one monthly bill you get a minute-by-minute picture: who consumes, when, how much, and what changed. It is the basis of every saving, of an energy management system, and of checking whether a measure actually worked.
Electricity prices for businesses are rising, and energy has become a line item that directly affects margins and export competitiveness.
Serbia's Law on Energy Efficiency and Rational Use of Energy and the 2022 Regulation require larger consumers to run an energy management system.
Replacing motors, compensating reactive power or moving shifts: without metering you know neither the baseline nor the result.
Savings
The biggest savings rarely come from one large investment. They come from consumption nobody sees. These are the places OMNI IQ watches in every facility.
Machines, compressors and lighting running at night, at weekends or between shifts while production is idle.
OMNI IQ compares consumption with the facility's operating hours and names the machines with the highest night load.
Part of a business electricity bill depends on the highest load in the billing period, not only on the energy used.
The platform records every new peak and shows who caused it, so large machines can be started in sequence.
A low power factor means excess reactive energy, which is billed separately and puts extra load on the installation.
Power factor and reactive power are tracked for the facility, every switchboard and every machine, as the basis for compensation.
A machine that consumes more than similar ones, or more than it used to, often signals a fault or poor tuning.
Energy Manager compares equipment with its peers and tracks its health over time.
Consumption rarely jumps at once. It creeps up week by week until it becomes the new normal.
The platform tracks weekly growth and the 30-day trend and warns before the increase shows on the bill.
When machines start, how shifts change over, how long heating and cooling run.
Alongside the data, our consultants propose operating schedules with lower peaks and less idle consumption.
We do not promise a percentage up front. Every savings estimate in OMNI IQ is calculated from your facility's measured data.
Platform
OMNI IQ is modular. You start with metering; insight, recommendations and reports build on the same data.
Power, energy, current and power factor per phase, for every switchboard and every machine. A live single-line diagram shows what is happening right now.
An analysis workbench: compare periods, shifts and loads, load profiles, peak demand, and data export.
Recommendations with root cause, estimated impact and priority. Every claim rests on measured data, with no invented percentages.
An industrial knowledge graph links your processes and equipment to the consumption patterns of your industry, so you know what is normal and what is not.
An offline meter or unusual consumption reaches you by e-mail or web push, with escalation, quiet hours and a daily digest.
PDF reports for management and maintenance, in Serbian or English, with an executive summary and scheduled delivery.
Ask about your facility in plain language. The assistant answers only from the data the platform holds.
A questionnaire and a mobile portal for site surveys, with photos, and current-transformer sizing from the breaker ratings.
Energy Manager
Energy Manager analyses the metering continuously and turns it into concrete tasks: what is wrong, why, what it costs and what to do. Your team decides; the platform tracks the work through to the result.
Analyses run all the time: off-shift consumption, new peaks, consumption growth, power factor, equipment and metering gaps.
For every finding the platform looks for the likely cause, such as a machine running without production or a phase imbalance.
Estimated impact in kWh and money, together with the effort to implement, decides what comes first.
A recommendation is acknowledged, assigned to an owner and tracked to the end, with a history of every change.
After implementation, the metering shows whether the measure delivered.
Night baseload above expected
Recommendation lifecycle
Energy health
Whether consumption behaves as before or keeps growing.
Efficiency
How efficiently the facility uses energy for the work it does.
Power quality
Power factor and reactive energy.
Equipment health
Machines using more than their peers or than they used to.
Monitoring reliability
Whether every meter sends complete data.
Cost optimization
How much room for savings is still left.
Grid and installation
Savings are not the only reason to meter. The same data show whether the installation is healthy, whether the load is balanced, and whether there is room for new machines.
For the facility, every switchboard and every machine, with a warning when it falls below the limit.
L1, L2 and L3 load side by side. Imbalance stresses the installation and shortens motor life.
Per-phase values for every meter, refreshed in real time.
How loaded a switchboard is against its capacity, and how much room is left for new loads.
Current transformers are chosen from the breaker ratings and the actual load, so the metering is accurate.
An offline meter, a communication loss or incomplete data shows up and is reported at once.
How it works
The same team takes you from the first conversation to the first recommendations.
A short questionnaire and a walk through the facility: switchboards, key loads, shifts. The result is a metering plan.
Current clamps go around the existing cables, with no rewiring. Each meter is configured in minutes and connects to the platform by itself.
From day one you see consumption per phase, machine and shift, live and over time.
Energy Manager proposes measures, our engineers review them with you, and reports show what was done and what it achieved.
Progress
Every measure has a baseline and a result. OMNI IQ keeps both, so management sees progress, not just cost.
The first weeks of metering become the reference for everything that follows.
Six facility scores and their trend show whether you are heading the right way.
Weekly or monthly PDF reports reach management and maintenance on their own, in the chosen language.
Savings are calculated against the baseline and operating conditions, not guessed.
Lower consumption is also shown as lower emissions, for sustainability reporting.
Resources
OMNI IQ is designed as one platform for everything a facility consumes. Electricity comes first; water and gas are in development.
Per-phase and per-load metering, power factor, peak demand, cost and CO₂.
Water use per building and process, leak and anomaly detection.
Gas for heating and processes, normalized by production and outdoor temperature.
The systems that often consume the most in industry and are measured the least.
Metering hardware
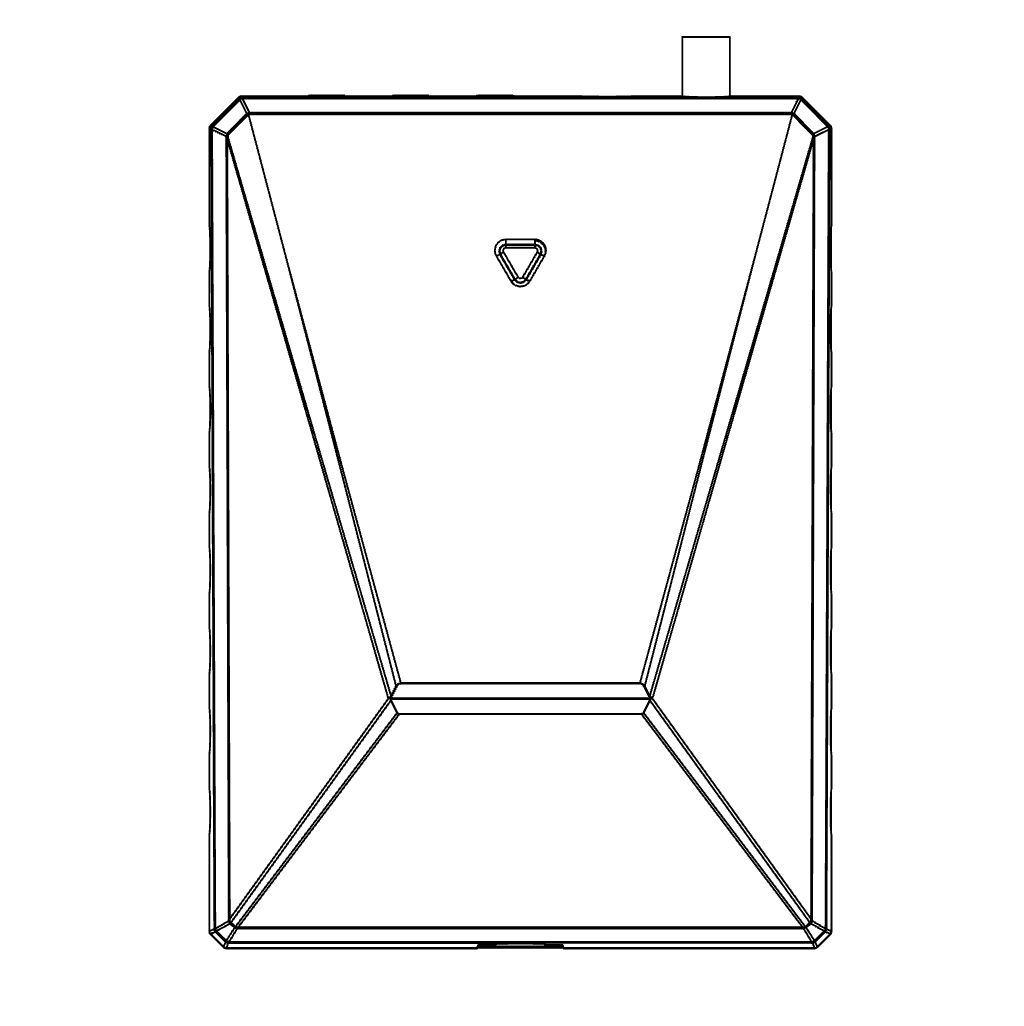
OMNI IQ uses three-phase Wi-Fi meters with current clamps (OWON PC341-W-MQTT). Technicians configure them with the Omni Meter Setup app: they type only the facility's Wi-Fi network, the app sends everything else, for many meters in a row.
Regulation
Serbia's 2022 Regulation on energy management obligors lowered the thresholds, so more companies than before now have the obligation.
OMNI IQ provides the metering, history and reports an energy manager needs, and our consultants help you introduce and run the energy management system, including preparation for ISO 50001.
Source: Law on Energy Efficiency and Rational Use of Energy (Official Gazette RS 40/2021) and the Regulation on energy management system obligors (Official Gazette RS 59/2022).
Consulting
The platform shows where the savings are. Our engineers help you get there: in electricity today, and in water, gas and other resources as OMNI IQ grows.
Survey, metering and consumption analysis, with a list of measures ranked by payback.
Introducing and running an energy management system, reporting, and preparation for ISO 50001.
From idea to delivery: reactive power compensation, drives, lighting, compressed air, shift scheduling.
Proof of results: what was saved, against which baseline, and under which conditions.
For serious organizations
Everyone sees only the facilities and data they are entitled to, and costs only when authorized.
Every significant change is recorded: who, what and when.
Encrypted communication from meter to platform, modern password storage and session protection.
Interface, reports and e-mail notifications in Serbian and English.
Every company, site and building on one map and in one overview.
Export your data and reports whenever you want.
FAQ
OMNI IQ is a platform for metering and analysing resource consumption in industrial and commercial facilities, developed by SolarLink d.o.o., Serbia. It meters electricity per phase and per load, gives savings recommendations and reports, and comes with engineering and consulting support. Water and gas metering are in development.
Energy monitoring is the continuous, automatic metering of energy consumption at the level of the facility, the switchboard and individual machines, with history and analysis. It shows who consumes, when and how much, and it is the basis of every saving and of an energy management system.
It analyses the metering continuously and finds off-shift consumption, new peak demand, consumption growth, low power factor and equipment that uses more than it should. For every finding it looks for the cause, estimates the impact and proposes a measure. Recommendations are acknowledged, assigned and tracked through to verification.
No, it gives the energy manager a tool: metering, analysis, recommendations and reports in one place. If you do not have an energy manager, our consultants help you with that work.
By comparison with the baseline from the first weeks of metering, under the same operating conditions. The result shows in the facility scores and in the reports.
Power factor shows how much of the current actually does useful work. When it is low, the grid carries more reactive energy, which is billed separately and puts extra load on cables and transformers. OMNI IQ meters it for the facility, the switchboard and the machine.
Three-phase OWON PC341-W-MQTT Wi-Fi meters with current clamps, installed in the existing switchboards, and a Wi-Fi network on site. The meters send encrypted data directly to the platform.
No. The current clamps are split-core and go around the existing cables. A licensed electrician installs them, and configuring one meter takes a few minutes.
As soon as a meter is configured and joins the facility's Wi-Fi, usually within a minute or two. History and analysis build up from that moment.
Under Serbia's 2022 Regulation, obligors include manufacturing companies consuming at least 25 GWh per site per year and trade and service companies consuming at least 7 GWh. We are happy to check your case.
It depends on the facility, and we do not promise a percentage up front. That is why we start with metering: recommendations and impact estimates in OMNI IQ rest only on your facility's measured data.
Electricity is available today. Water and gas metering are in development, and the platform was designed for every resource from the start.
The interface, reports and e-mail notifications are in Serbian and English, and every user chooses their own language.
Tell us what you produce, how much you consume and what bothers you most. We will propose a metering plan and the first steps.
Write to us